My first trading models knew which companies would survive

Image credit: author, drawn with code
My first live trading bot started trading real money on December 2, 2024. The models behind it had been trained on years of stock-market history, and every company in that history had something in common: it was in the S&P 500 on the day I trained the model.
That sounds harmless until you think about what it leaves out. A company that was in the index in 2016 and went bankrupt in 2019 wasn’t in the training data at all, and a company that joined the index in 2025 was in it all the way back. In other words, the models learned from a version of the market where nothing ever failed and every stock was already a future winner.
That was a leak, and it went live. It wasn’t the only one either.
If you haven’t built one of these systems, here’s what I mean by a leak. You can’t test a trading model by waiting ten years to see how it does, so instead you backtest it: replay history, let the model pick stocks as if it were living through each date, and score those picks against what actually happened next. A leak is any information that sneaks into that replay which the model couldn’t have had on the date in question. It doesn’t have to be anything as obvious as tomorrow’s price. Knowing which companies will still be around in five years is enough, and the result is a backtest that looks better than anything you could have done for real.
The standard defence is to train walk-forward. For each rebalancing date (the days the portfolio is reshuffled, roughly monthly for me), the model trains only on data from before that date, picks its stocks, holds them until the next rebalancing date, and then the whole thing steps forward and repeats. That way, no single model is ever scored on data it was trained on. Walk-forward is necessary, but as you’ll see, every leak in this post got through it, because each one smuggled the future in somewhere other than the training dates: the list of stocks, the shape of the data, or the data itself, through prices adjusted the wrong way or figures dated before anyone could have known them.
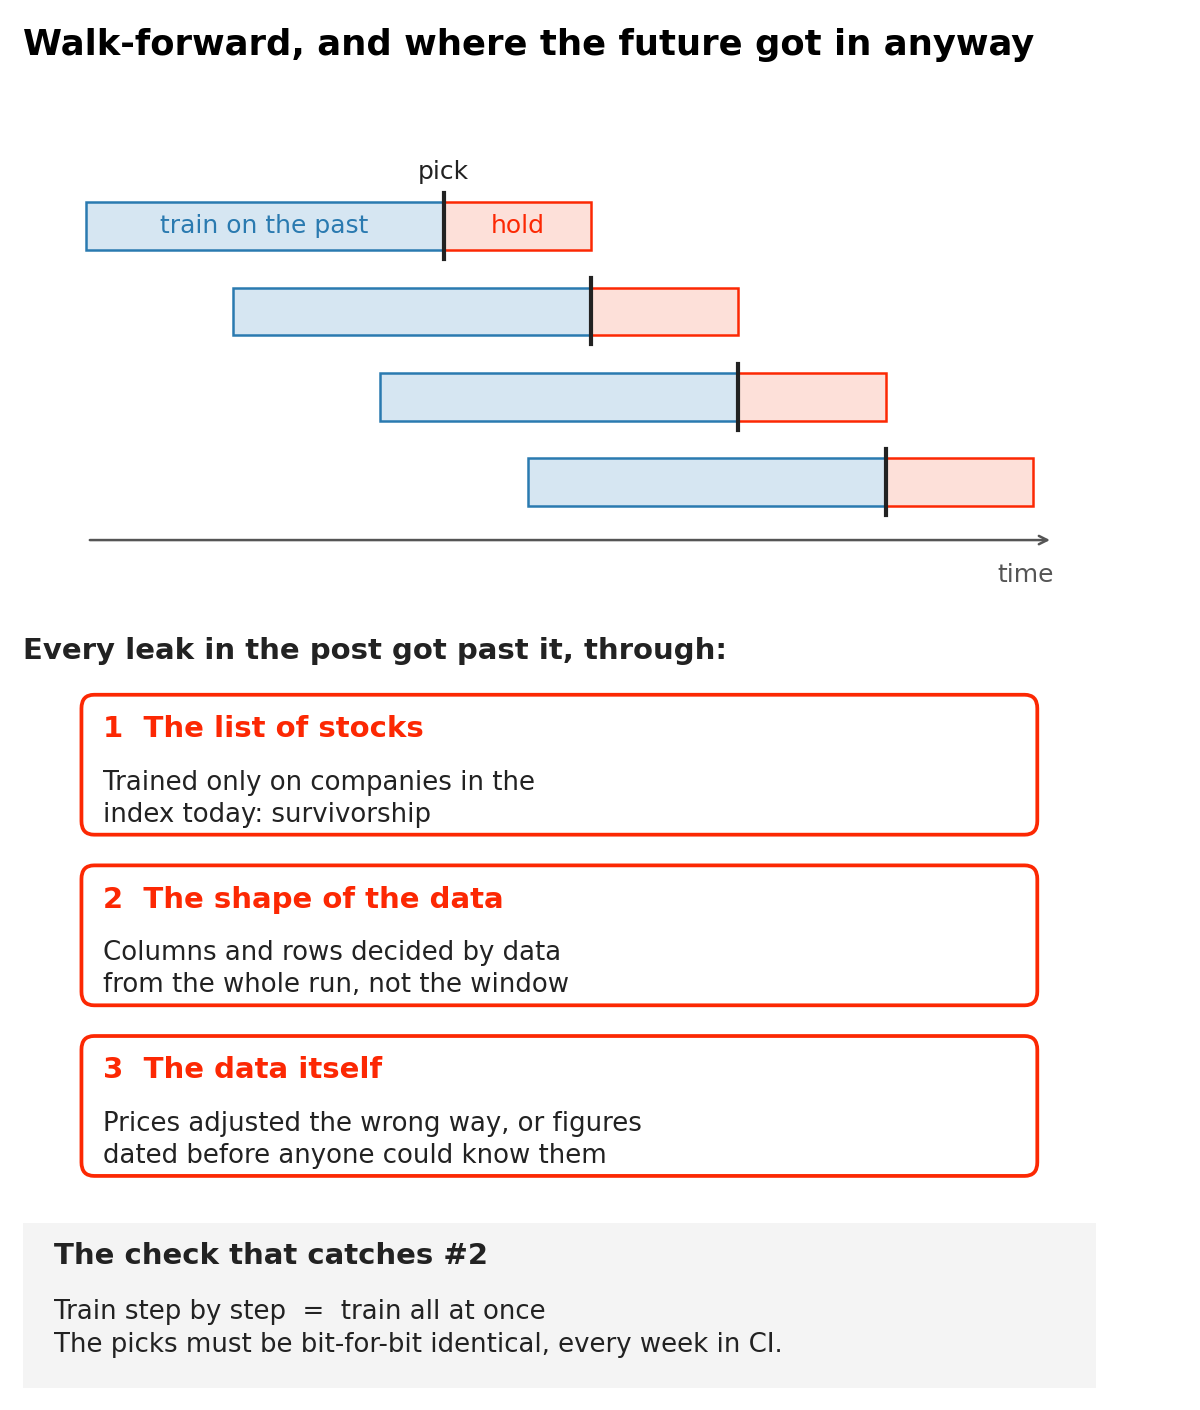
So, this post is about the leaks I shipped, the ones I caught in research before they shipped, and the times an AI was sure it had found a leak and was wrong. Every one of them is a reason that backtests are hard to trust, including your own. Along the way I’ve ended up with one rule for all three: you can’t reason your way to the answer. You need a test that makes a leak show up as a number.
Survivors
What gave it away was a backtest that was too good. I tune the model by running hyperparameter searches, where I backtest hundreds of versions of the model with different settings and compare them. In August 2025, one of those runs came back with a 2020 that was simply impossible, and most of that year’s profit came from a single holding. When I went to look it up, neither Yahoo Finance nor Google Finance had any prices for its ticker before 2021, and my note from the investigation reads: “Perhaps the symbol was renamed?”
It had been. It was Chesapeake Energy, which had been dropped from the S&P 500 in 2018, did a 1-for-200 reverse split in April 2020, went bankrupt later that year, and eventually merged, took on a new name and rejoined the index in 2025. My backtest was holding it in 2020, two years after it had left the index, because the training code only knew about the index as it stood today. (Keep that reverse split in mind, as it shows up again later in this post.)
Fixing survivorship bias turned out to be mostly a data problem. First, I needed the S&P 500’s membership for every day of the training period, not just the current list. I built this from the public record of index changes and had a couple of AI models double-check the list. Then I needed price history for the companies that had left the index, many of which no longer trade. Finally, the training loop had to resolve the set of stocks it was allowed to pick from (its universe) date by date, so that a model trained on 2016 data only ever saw companies that were actually in the index in 2016.
When the fix first ran, the backtest fell apart. The note I left myself in the pull request was, in all caps, “THE ANNUALIZED RETURN IS NEAR 0!!!” That’s what removing a leak is supposed to do, and it’s a very unpleasant thing to watch.
The fix reached the production training path in late September 2025, about ten months after the first live trade.
There was one experiment from that period that I’m still glad I ran. I wondered whether a small, controlled leak might be acceptable: train the first stretch of the model on a later snapshot of the index, so that it learned from today’s large companies, and then walk forward point-in-time from there. It gave no reliable improvement. My conclusion at the time was that a model trained on a fixed list of companies never sees a stock enter or leave the index, which leaves it less prepared for the real index, where that happens all the time.
Unfortunately, that wasn’t the end of it. A year later, in October 2026, a copy of the equal-weight S&P 500 that an agent and I had rebuilt from my research data beat the real equal-weight index fund by a margin that a copy has no business beating it by. The two moved almost in lockstep, so the copy was tracking the right thing, but it was consistently doing better. That’s the same “too good” signature, and it turned out to be survivorship again, coming from two places.
The first was the membership list itself. The public record of index changes I’d built it from is sparse before about 2007, so the early lists were short and slightly wrong. To check, we rebuilt membership from the holdings of an S&P 500 index fund, which has to file its complete list of holdings with the SEC. Against those filings, my list was 74 companies short in 2001 and still 5 short in 2009, and it even contained a few companies that hadn’t gone public yet. The AI models I’d asked to double-check the list in 2025 hadn’t caught any of this.
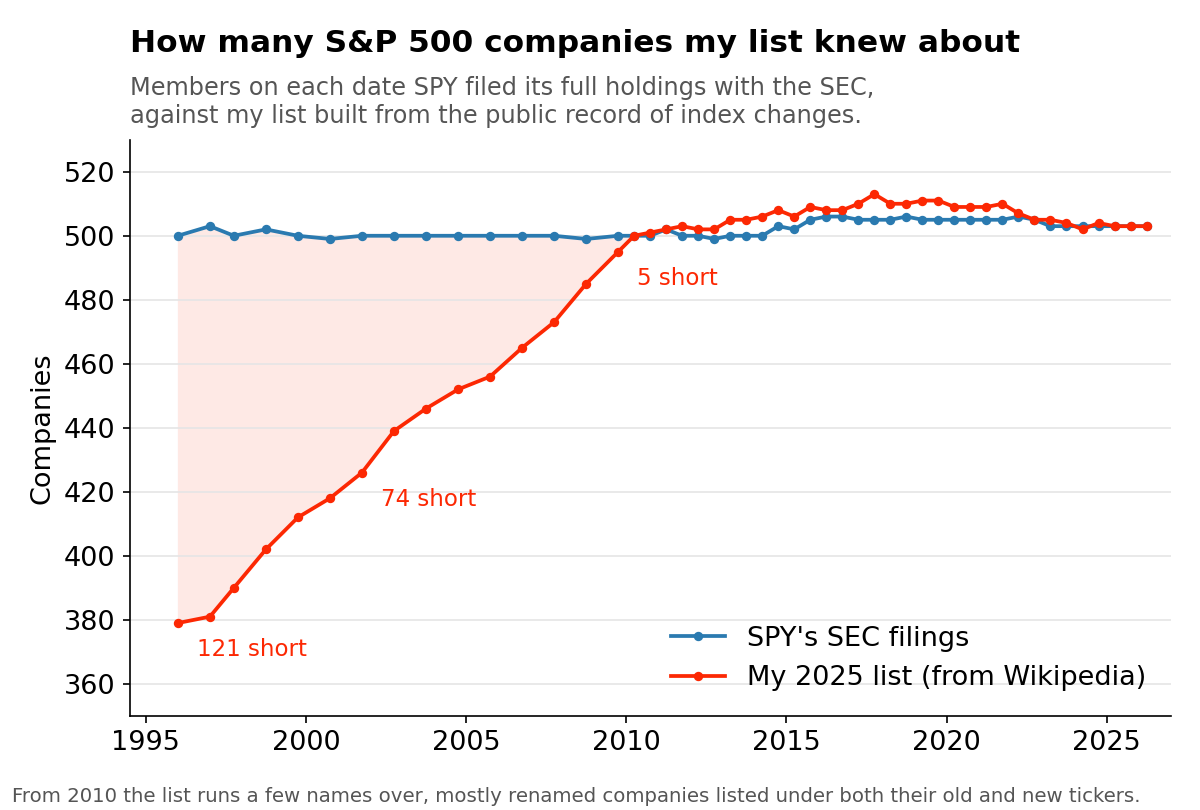
How many S&P 500 members my list knew about, against the holdings SPY filed with the SEC. The gap is the least my 2025 fix still left out, since the list also held a few companies that hadn’t gone public yet.
The second was prices. Many of the companies that failed outright, like Lehman Brothers, Bear Stearns, Enron and WorldCom, have no price data in either of my data sources, so even with a correct list they can never be picked or held in a backtest.
This one mostly affects my long-history research backtests rather than the live system, since the data the live configuration was chosen from covers 99.6% of index members. But it means that for my backtests before about 2016, the honest reading is “probably an upper bound”, and fixing it properly needs a data source that still sells prices for companies that no longer exist.
So, What Did It Cost?
I don’t know, and I think the reason is worth explaining.
First, a correction to the intuition. A live model can’t see the future, because on the day it makes a prediction there’s no future data to see. Today’s S&P 500 list is the correct list for today. So, the live models were never peeking at tomorrow’s prices. The damage was in two other places:
- The backtests I used to choose the model and its settings were inflated by the leak, so the configuration that went live was selected on a flattering number.
- The live model had been trained on a history with no failures in it, so whatever it had learned, it had learned from survivors.
Putting a price on that requires comparing what the model expected with what the account actually did, period by period, and in 2025 I had no mechanism for tracking that gap. Moreover, the model worked from end-of-day closing prices while the orders filled the next morning, so any gap I computed mixed model error with hours of ordinary market movement.
That was a consequence of how the early system worked. It ran at a fairly leisurely pace after the market closed: download the day’s prices, retrain the model, decide what to buy and sell, and queue the orders for the next morning. Since then, a lot of optimization and engineering has gone into doing all of that during the trading day. The system pulls a price snapshot at a fixed time in the morning, trains the model on it and starts trading, with a median of about 12 minutes from the snapshot to the first fill. For bots that run this way, the model’s prices and the fill prices are now minutes apart instead of a night apart.
There are also now reports that split a bot’s live result into what the model predicted, what the portfolio’s composition delivered and what execution cost. When I finally ran those reports across the live history in September 2026, every period I analyzed had run without a fixed price time, so the execution numbers came with a caveat that they couldn’t really be read as execution at all. The measurement that would have priced the leak simply didn’t exist yet.
The Leak the LLMs Couldn’t Find
Survivorship was actually the second leak to reach production. The first was subtler, and it’s where most of the testing in the rest of this post came from.
In March 2025, while analyzing the returns of a newer model, I started to worry that there was leakage in the older one. So, I compared two ways of training the same model. One trained incrementally, one rebalancing period at a time, exactly as it would run live and exactly as walk-forward requires. The other trained over the whole period at once. Given the same data and the same settings, they should have produced the same results, but the annualized returns were different.
I asked the LLMs I was working with to explain the difference and they couldn’t. The pull request I opened to debug it says so directly: “The LLMs appear to be unable to determine why the annualized returns for leakage_check.py and train_and_predict.py differ. Let’s roll up our sleeves and figure this out.”
Rolling up my sleeves meant writing a logger. I logged every call to fit() and
predict(), along with the shape and columns of every input, to a JSON file without
timestamps, ran both paths and diffed the files. Then I shortened the run until I had
the smallest period that still showed a difference and stepped through it in the
debugger.
The difference was in the shape of the training matrix. Which columns it had, and which rows survived a filter for missing values, depended on the data loaded for the whole run rather than just the training window. When training all at once, the model for an early period was shaped by companies whose data only began years later. When training incrementally, it didn’t know those companies existed yet. Neither path was reading a future price directly, but the future was deciding what the training data looked like, and that turned out to be enough to change the results.
The comparison that found the leak became a test: train incrementally on part of the data, continue on the rest, and the picks must be bit-for-bit identical to training on all of it from scratch. It started as a script that I ran by hand, then became the code path that production uses to train, and it now runs every week in the automated test suite. If I could only keep one test from this whole project, it would be this one.
The Fix That Switched Off Most of the Model
Unfortunately, the March 2025 refactor fixed the leak and broke something else, and nothing noticed for thirteen months.
Near the end of the data-preparation step, the refactored code selected the training columns by matching column names against a list of ticker symbols. The raw return column for each stock is named after its ticker, so it matched. However, the engineered features (moving averages and volatility measures built from those returns) have the ticker as a prefix rather than as the whole name, so they didn’t match and were dropped. A later step, which lines up every iteration’s columns with the model’s expected list of features, then quietly put them back, filled with zeros.
The model ran, the tests passed and the features were all present in the matrix. Every one of them was zero, and that version went into production along with the leak fix.
It finally came out in April 2026, while an LLM and I were wiring a new family of features into the training pipeline. Earlier that same day we had found a different silent drop, where three new settings were decoded from the model’s configuration and then never passed to the model. When we looked at how much the trained models relied on each input (their feature importance), every engineered feature had an importance of exactly zero.
The fix went in behind a flag so that it could be compared with the old behaviour, and a week later it became the default. If you read my last post, you may recall a change that did nothing, where two runs came back bit-for-bit identical. This is the same smell from a different angle, and I now treat an exact zero with the same suspicion as an exact match.
Corporate Actions Keep Coming Back
Most of the leaks I found in 2026 came from the same place: splits, reverse splits and dividends, which are known as corporate actions.
A quick primer, since everything below depends on it. A raw price is what a stock actually traded at on a given day. When a company does a 20-for-1 split, every share becomes 20 shares worth a twentieth as much, so the raw price drops 95% overnight even though no one lost a cent. A reverse split is the opposite: 200 shares become one, and the raw price jumps 200-fold. An adjusted price rewrites the history before each event so that the series is continuous, e.g. by dividing every price before a 20-for-1 split by 20, and it does something similar for dividends. Neither series is wrong. They answer different questions, and the bugs below all came from asking one series a question meant for the other.
I told the stock-dividend story in my last post, where a test asserted a data convention that never occurs in practice. Here are three more.
The Model Learned to Short Stock Splits
In a long/short research line, which buys some stocks and bets against others by shorting them, so that it profits when they fall, one data source’s features were computed from raw prices rather than adjusted ones. So, when Amazon split 20:1 in June 2022, the raw series showed a one-day move of about −95%. Alphabet’s 20:1 split about six weeks later looked the same, and Tesla’s 3:1 split read as −67%.
A −95% day dominates any ranking of stocks against each other, and the model’s momentum-style features, which look at how much a stock has risen or fallen recently, carried it for one to three months afterwards. The model learned that stocks with that shape made good shorts, but they weren’t failing companies. They had just split.
A Copilot agent found it while comparing the same strategy across two data vendors. One vendor’s prices came pre-adjusted, the other’s feature panel had been built from raw prices, and the two short sides disagreed by far more than data noise should explain. A simple count shows the problem: in a 2019 sample, 9.7% of the symbols in the raw panel had a single-day move bigger than 50%, against 6.1% in the other vendor’s adjusted data.
What I find interesting is why raw prices had been chosen in the first place. Adjusted prices rewrite the past, e.g. a 2022 split changes the adjusted price for 2018. That looks exactly like lookahead, so raw prices seemed like the safe choice. However, these features were ratios: a price today divided by a price from some days ago. For any window that doesn’t straddle a split, the split factor cancels out and raw and adjusted prices give identical values. For a window that does straddle a split, the adjusted ratio is the true economic return and the raw one is an artifact. In other words, the thing that looked like lookahead wasn’t, and the thing chosen to avoid it was the bug.
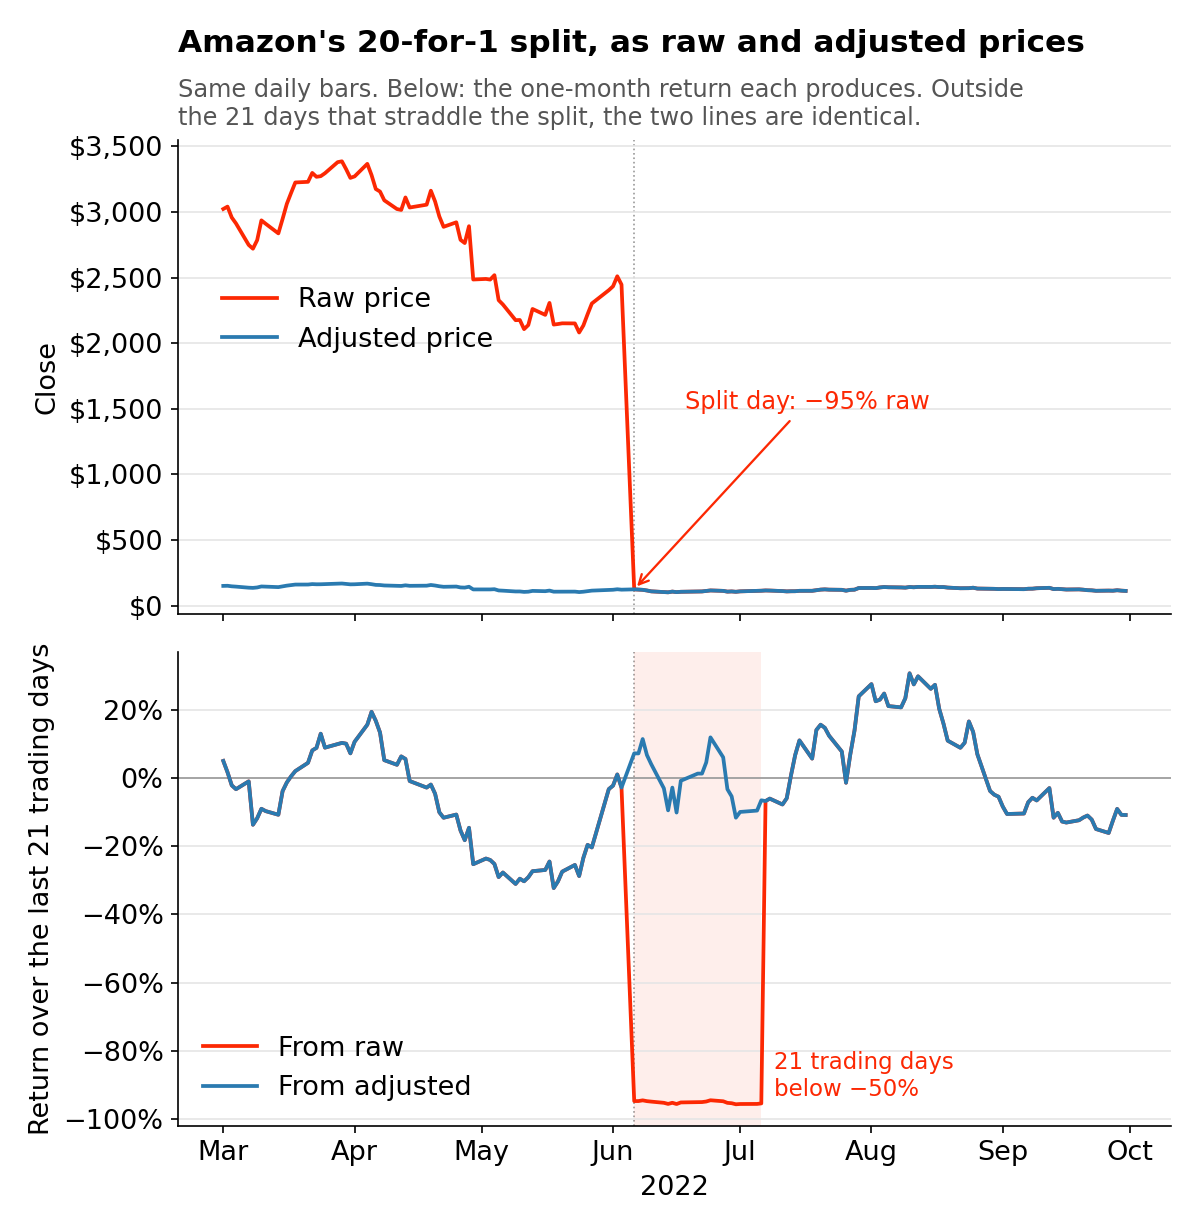
Amazon’s 2022 split as raw and adjusted prices. The raw one-month return reads as a 95% crash for a month: the shape the model learned to treat as a good short.
Ratios Want Adjusted, Levels Want Raw
The mirror image turned up about a month later. The same research line had a minimum-price filter so that it wouldn’t trade anything under $10, and it was being applied to adjusted prices.
After a large reverse split, adjustment inflates a stock’s earlier history. A shell company that really traded at a fraction of a cent, and then did a reverse split of a few hundred to one, ends up with an adjusted history of tens to thousands of dollars. So, those names passed the $10 floor, were trained on and were shorted, and the backtest booked wins on positions that nobody could have actually held. Claude found this one while investigating short-side results that still looked wrong after the earlier fixes. Gating on the raw price instead took the number of candidate instances priced under $10 from 11,194 to zero.
The rule I took from the pair is that a ratio wants adjusted prices, because it’s asking how much a holding changed, while a price level wants raw prices, because it’s asking what the stock actually traded at. Neither series is a safe default.
After four layers of price corruption had been removed from that research line, its log summed it up plainly: the earlier positive results had been “largely the corruption we removed.”
The Screen in Front of Everything Was Leaking
This last one is the one I find most instructive, because it was in the tool I use to decide what is worth testing in the first place.
I screen new signal ideas (candidate inputs for the model) with a quick check that runs in seconds, before committing to a hyperparameter search that runs for days. It asks a simple question: on each past date, did ranking stocks by this signal put them in roughly the right order of what they did next? In September 2026, an agent using that screen to check a textbook momentum signal for another project found that the screen itself had two problems.
The first was that it loaded prices through a function whose adjusted flag defaults to
False, and which returns its price column under the key "Adj Close" either way. The
variable was named for adjusted prices, the column was named for adjusted prices and
every statistic downstream said adjusted, but the data was raw.
The second was that it built its universe once, for the whole run, from every company that had ever been in the index. On the dates checked, 42 to 47% of the names it was ranking on a given date weren’t index members on that date. Some joined later, which is lookahead, since companies are added to the index because they grew. Others had left years before.
The tell had been sitting in the documentation for months, as a statistic with a note beside it saying “investigate”. It traced back to Chesapeake’s 1-for-200 reverse split in April 2020, the same reverse split from the survivorship investigation a year earlier. Here, raw prices turned it into a gain of more than 10,000%, and it was counted twice because the universe carried both the old and the new ticker. The problem also generalizes. Reverse splits tend to happen to companies in trouble, and companies in trouble are exactly what sits at the bottom of a ranking by recent performance, so any signal that sorts on losers is contaminated in the same direction.
Fortunately, the decisions I had made with that screen were based on rank correlation, which only asks whether the stocks came out in the right order, not by how much, so a few enormous outliers barely move it. When the agent recomputed a signal on corrected data, its rank correlation hardly changed, so those decisions probably still stand. Two other columns in the screen’s output didn’t survive. A leak doesn’t always invalidate everything it touches, and most of the work is finding out which numbers it actually reached.
Time Has Two Dates
Point-in-time doesn’t just mean the date on the row.
Some data describes a period but only becomes public later. One data vendor only keys its quarterly company financials by the end of the quarter they describe. A company’s December quarter isn’t public until its annual report is filed, around the start of March for the largest companies, and the vendor then needs time to pick it up. A reporting lag of 45 trading days after the period end made those numbers “known” a week or two before the vendor would actually have had them. That setting had already stood out in my hyperparameter search results, and the vendor’s own documentation settled it, as the period end is the only date it provides. So, I removed the option.
EDGAR, the SEC’s filing database, does record the filing date, so when I later needed historical share counts, I keyed them on the date they were filed, typically about five weeks after the quarter they describe. Keying on the period end would have used numbers that nobody could have known yet.
One vendor field had no code bug at all. An earnings-surprise figure (how far a company’s reported earnings beat or missed what analysts expected) was being computed against the analysts’ average forecast as it stood after later revisions, rather than as it stood on the day the earnings came out. The fix was to rebuild it from point-in-time estimate snapshots, which meant dropping every year before the snapshots begin and about a fifth of the symbols, which had no snapshots at all. Sometimes an honest fix makes your dataset smaller.
The False Alarms
Leakage can also go wrong in the other direction.
In August 2025, in the middle of the survivorship work, two issues drafted with an AI’s help claimed there was lookahead in my volume filter and in how the code decided which symbols were available. Both read convincingly. When I traced the dates, though, the rebalancing decision happens at the end of the window the code was reading, so all of that data was already known. My reply on the first one starts, “Actually, I believe we DO NOT have a lookahead bias.”
A year later, an agent flagged code that was, in its words, “target-leakage-shaped”: the training target also appears among the input features. It does, and at a glance it looks alarming. However, tracing every date boundary showed no lookahead, as the training window ends where the test window begins and returns are measured forward from the pick date. The agent’s follow-up claim, that the model must therefore be a simple momentum ranker, didn’t survive a measurement either. That’s two confident answers, each corrected by measuring rather than arguing.
The repo’s instruction file for agents now says that any leakage claim must name the
specific date boundary that it violates and cite the code path, and those boundaries
are pinned by tests named test_no_lookahead_*.
Who Found What?
When I went back through the issues and pull requests to write this post, the pattern was clearer than I’d remembered. I found the early leaks, the ones that reached production, from numbers that were too good or didn’t match: an impossible year and two training paths that disagreed. The 2026 leaks were mostly found by agents, and almost never while they were looking for leaks. They turned up while we were wiring new features, building a new test harness, comparing two data vendors or checking a rebuilt index against the real one, with me reviewing what came back. The agents also raised most of the false alarms.
The tests mostly arrived after the leak that justified them. I don’t think that’s a failure. A test written before you’ve been bitten is a guess about where the bugs are, whereas a test written afterwards is a record of where they were.
Making Leaks Show Up as Numbers
Here’s what actually caught things, roughly in the order that I’d add them to a new project:
- Invariance. A result for a past window must not depend on the future. Training incrementally must match training all at once, and moving a run’s end date must not change an earlier window. The March 2025 leak broke exactly this, and so did a similar one I found later in a different research line, where extending a run’s end date changed results for years that were already over.
- Counts of the impossible. Single-day moves beyond 50%, prices under a cent passing a $10 filter, feature importance of exactly zero, or a year of returns that no strategy has ever produced. Several of the leaks in this post would have shown up in a count like that well before they showed up in a result.
- Point-in-time by construction. Resolve index membership per date, from the best source you can find, and key vendor fields on when they became knowable, not on the period they describe.
- Compare against something real. A copy of an index fund that beats the fund, or two vendors that disagree, is a leak or a data bug until proven otherwise.
- A pure-noise null. Run the whole pipeline on random-walk prices, where there’s no signal by construction. If it finds one, it leaks. In one research line, after four leak fixes, the null finally sat on zero, and that was the result I trusted most.
- Replication on independent data. When an agent hands you an encouraging statistic, rerun it on data it hasn’t seen before you believe it.
This describes software I run on my own accounts. It is not investment advice and I do not offer investment services.