Changing only the random seed made my trading model look twice as good
Image credit: author, drawn with code
This is a story about how I found out that most of the decisions in one of my research logs were coin flips, and about what I changed so that it wouldn’t happen again.
In September 2026, I ran the same research model eleven times. The code, the data and the settings were identical each time, and the only thing I changed was the random seed. The best of those eleven runs scored about twice as well as the worst.
That would just be a curiosity if I hadn’t spent months making decisions by comparing a single run against a single other run. When we went back through the research log for that model, 14 of the 21 decisions it recorded, mostly about whether to keep a feature or throw it out, rested on a difference smaller than what the seed alone could produce.
If you’re new to this, here’s a bit of background. I build models that pick stocks, and I can’t test one by waiting ten years to see how it does. So, I backtest it: I replay history, let the model make its picks as if it were living through each date, and score those picks against what actually happened next. I also run hyperparameter searches, which backtest hundreds or thousands of versions of a model with different settings and compare them. Over the last couple of years, that has added up to a lot of models.
In my last post, I wrote about leakage, where information from the future sneaks into the replay and makes a backtest look better than anything you could have done for real. This post is about two other ways of fooling yourself: noise, and the choices you make as the researcher. They’re harder to catch, because neither of them is a bug in the code.
Where Did This Start?
It started with a rerun. Earlier in 2026, I had measured what my live trades actually cost to execute, and the answer was close to nothing. That made me wonder whether a few research lines that I had already closed deserved a second look, since some of them had been judged with a cost assumption that was now clearly too pessimistic. So, an agent reran some of the old experiments.
When I reviewed the agent’s work, the conclusions held up, but several of the supporting numbers were wrong. Fixing those meant actually running a check that had been skipped, and that check reran a configuration from the old log with the identical command. The log had recorded it as a solid result. The rerun came back negative.
The first question was whether the engine was random at all, and it wasn’t. Two runs with the same seed on the same machine produced results that were identical down to the byte. So, whatever had changed between the original run and the rerun, it wasn’t chance, and the data changes since then became their own investigation.
However, it raised a question that I had never asked. If the engine gives the same answer every time for a given seed, how much does the answer move when the seed changes?
How Much Does a Result Move When Nothing Changes?
First, a little background on why a seed matters at all. The models in that research line were gradient-boosted trees, and like a lot of tree models, each tree is trained on a random subset of the features and a random subset of the rows. The seed decides which subsets. If you change it, you get a different set of trees from the same data, which is supposed to be a detail.
On September 8, 2026, Claude and I held one configuration fixed and ran it with eleven different seeds over the full four-year research window. The best seed scored about twice as well as the worst. From that spread, you can work out the smallest difference between two single runs that you can trust, i.e. a difference that you’d only expect to see by chance about one time in twenty.
Then we went back through the log. It recorded 21 decisions that had been made by comparing one run against one other run, and 14 of them rested on a smaller difference than that. Some were features I had thrown out as harmful, and four were features I had kept because they seemed to help. In other words, the evidence on file couldn’t tell any of those 14 variants apart from the run they were compared against, in either direction.
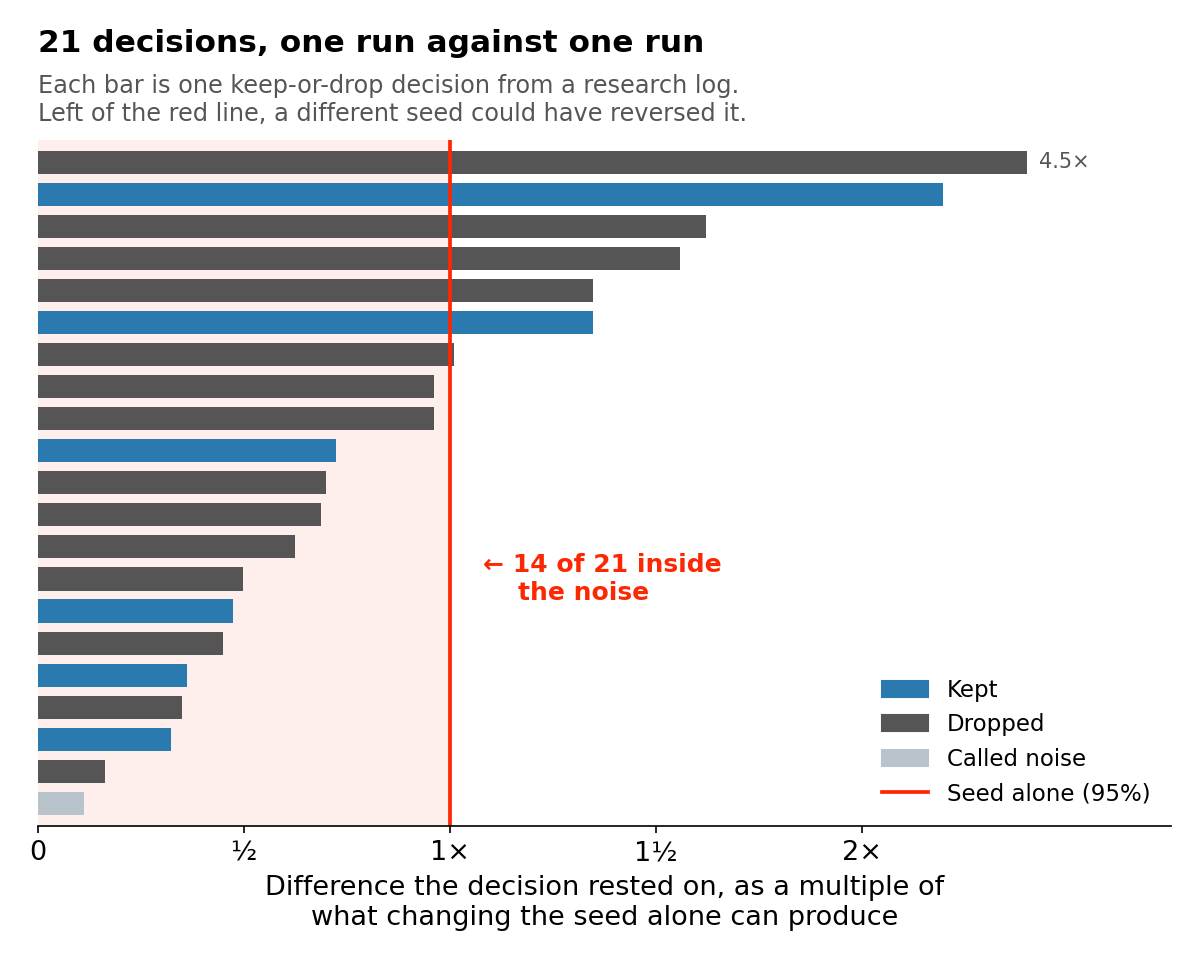
Each bar is one of the 21 keep-or-drop decisions in the research log, measured by the difference it rested on, as a multiple of what the random seed alone can produce. Fourteen fall short of the line.
One of those four soon confirmed it. A later rerun, done properly this time with the same seed on both sides, found that a feature the log had recorded as helping was actually hurting. That’s exactly what you’d expect from a difference inside the noise, since it can come out either way.
Fortunately, none of those features were in production, so nothing needed reverting. But the same habit of comparing one run against one other run was also in my more active research lines. When we measured the noise for the daily research engine the same way, one recorded decision stood out. In a long/short research line, which buys some stocks and bets against others by shorting them, the time of day to trade had been chosen on a difference between 17 and 29 times smaller than that engine’s noise. In other words, the backtest couldn’t separate the candidate times at all. The same measurement also showed that the worst loss from peak to trough was even more sensitive to the seed than the score was, and more than doubled between the gentlest seed and the harshest.
So, when does my live system trade? Shortly after the open rather than at the opening bell, and I’d defend that without any backtest. The first stretch after the market opens is the most volatile part of the day, which makes it hard to hit a price target or to model the price you’ll actually get. That reasoning is about how the market works, and no seed can flip it.
The rules that came out of all this are short:
- No feature is declared harmful, or kept, on a difference smaller than the measured noise.
- Comparisons either use the same seed on both sides, or run several seeds per side and compare the averages.
- The seed, the number of threads and where the data came from are stamped into every recorded result, so that any number in the log can be reproduced.
There was one more surprise in the details. The library we were using doesn’t pick a random seed when you don’t give it one. It uses fixed defaults, so every “unseeded” run in the log had been perfectly reproducible all along, and had been sitting on one arbitrary draw that nobody had recorded or varied. Moreover, setting the seed to 0 doesn’t reproduce those runs, because it overrides the defaults with different values. The agent had assumed that it would, and there’s now a test that pins the fact that it doesn’t.
This was tough to learn, as it had taken me a lot of time to engineer myself into those conclusions. Once the coin flips came to light, I kept pushing to see if there was a way to improve the statistical significance of my results. That question, how long it takes before you can tell a real edge from luck, runs through the rest of this post.
Can I Rebuild an Index Fund From Scratch?
A couple of weeks later, I wanted a fair comparison for my own model: something cheap and simple that I could hold it up against, over long stretches of history that included real bear markets. The obvious candidate was a public momentum index fund, which holds the stocks that have risen the most over the past year. It’s one of the cheapest and best-known ways to buy a simple stock-picking rule, which makes it a fair bar for any model that picks stocks. The problem was that the fund only goes back to 2015, and its index’s history before that is the index provider’s own backtest.
So, the plan was to rebuild the index from its published rules, using my own data, and run it back through history myself.
The catch is that a rebuilt index involves a lot of choices, e.g. how far back to measure momentum, how to size each position and when to rebalance (reshuffle the portfolio), and every one of them is a knob. If I build the benchmark, look at how my model compares, and then adjust the benchmark, I’ve tuned my own yardstick.
To avoid that, the spec was written first and merged before any construction code existed. It included a gate that the rebuild had to pass over the years where the real fund exists: its annual return had to land within three percentage points of the fund’s, its risk-adjusted return (how much it earned for how bumpy the ride was) had to be within a fixed margin, and its returns had to move with the fund’s, period by period, with a correlation of at least 0.8, where 1 means moving in lockstep. All three had to pass or the rebuild was disqualified. The spec even explains why it was written first: every parameter is a researcher degree of freedom, and my research log already had four results on record that had been retracted after a closer look.
Writing the gate first wasn’t a new habit for me. When working with LLMs, I’ve found that you have to have very clear acceptance criteria, especially if you want an agent to run unsupervised for long periods of time. I set the initial rules and then refined them with the models.
There was one more guard. The benchmark was deliberately not registered as one of my models, as registered models can be fed into the hyperparameter search. Otherwise, someone, or more likely an agent, could have swept the benchmark’s own parameters and kept the best-scoring version. Changing it requires editing the code, which shows up in the history.
On September 23, 2026, the first build failed the gate by a wide margin. The leading suspect was that it weighted every stock equally, while the real index weights by company size. So, the second build pulled historical share counts from EDGAR, the SEC’s filing database, and weighted by size. That closed about a tenth of the gap, and it failed again.
That second failure was actually useful. A pass would have justified buying a commercial dataset to reach further back in time, but closing only a tenth of the gap meant that better share counts weren’t the problem. So, I found out that the data wasn’t worth buying without having to buy it.
Was That Moving the Goalposts?
This is the part I’ve thought the hardest about how to tell honestly, because the spec said that if the gate failed, the work stopped. It failed twice, and I didn’t stop.
What changed was the diagnosis. The benchmark had been built to rebalance on my model’s dates, roughly once a month, so that a comparison between the two would only differ in how they picked stocks. Meanwhile, the gate asked it to track a fund that rebalances twice a year. Those two requirements contradict each other, so the gate was close to impossible to pass by construction, and both failures had to be read in that light.
So, the work split into two builds with different jobs. The first is a faithful replica on the fund’s own twice-a-year schedule, and its only purpose is to pass the gate and prove that the index can be recreated from my data at all. The second is the monthly build that my model gets compared against, which is then justified by the replica passing. The thresholds never moved, and each new attempt was written up as its own issue, with the reason it might close the gap, before it was run.
On the fund’s own schedule alone, the replica still failed. Then it was weighted by the shares available to public investors (the free float, which is what the index uses), rather than every share a company has issued, and it passed. That happened in the third pull request of the day, about an hour and a quarter after the first failure was merged.
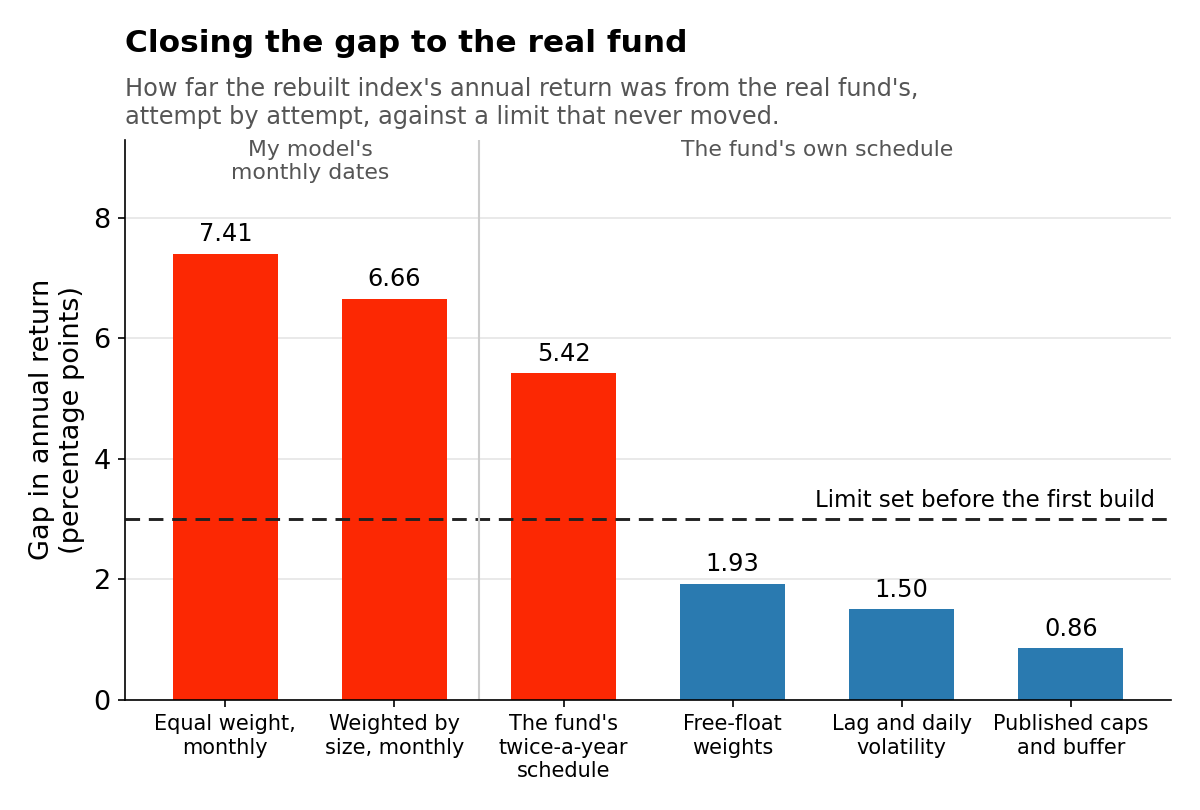
The gap between the rebuilt index and the real fund’s annual return, step by step, against the pre-registered limit of three percentage points. The first two were scored on my model’s monthly schedule, the rest on the fund’s.
That being said, I don’t think “the thresholds never moved” settles it. A gate that you’re allowed to keep attempting is a search of its own, and with enough attempts, something will eventually pass. What convinced me that this one hadn’t just been searched into passing was the next step.
What If You Fit to Holdings Instead of Returns?
A replica that matches the fund’s return could still be holding the wrong stocks, as lots of different portfolios produce similar returns over a few years, especially when they’re all tilted the same way. However, the fund has to file its actual holdings with the SEC, so there’s a much harder target available: the list of roughly 100 companies it held at each rebalance, and how much of each it held.
So, with the gate already passed, Claude compared the replica against those filings. The first result said that where the replica held the same company as the fund, it sized it almost exactly right, but about a third of the companies were different.
Two bugs in the comparison itself came out along the way. It had been pitting a freshly rebalanced replica against holdings from months after the fund’s last rebalance, and the code that matched company names to tickers had been quietly dropping as much as a third of the fund’s holdings. For example, a check for " CO" ate the “Cos.” in “Marsh & McLennan Cos., Inc.,” which then matched nothing. After both fixes, the replica still disagreed with the fund on about a third of the companies, so the difference was real and it was in how the replica ranked stocks.
Part of that ranking was still a guess, and the agent couldn’t read the index provider’s methodology document, because the provider’s site blocked automated downloads. So, it swept the uncertain parameters and scored each setting by how many of the fund’s actual holdings the replica matched, never by return.
One sweep found that the index measures momentum about 42 trading days before each rebalance, rather than on the rebalance date itself. That moved the share of matching companies from about two thirds to about 80%, and it did better on the filings that were held out of the sweep, which it never saw while choosing, than on the ones it was fitted to.
Another sweep, over how many weeks of volatility (how much a stock’s price swings) to measure, came back flat across a tenfold range. That turned out to be the clue, as the form was wrong rather than the length. A line in the fund’s own documentation described volatility as measured on daily returns, not weekly, and on the holdings, one year of daily returns beat the old assumption on the held-out filings. A shorter window won on the filings it was fitted to and lost on the held-out ones, which is what overfitting looks like: a setting that fits the quirks of the data it was tuned on rather than the real pattern. So, the agent took the round one-year value instead.
Neither change was chosen by the gate, and the commit messages say so when the gate didn’t cooperate. The lag narrowed the return gap, while two of the gate’s other measures got slightly worse. Switching to daily volatility didn’t move the return gap at all, and it was adopted on the strength of the documentation and the held-out holdings.
Then I downloaded the methodology document by hand, and its appendix confirmed both. Volatility is the “standard deviation of daily price returns,” and momentum is measured between month-ends ending two months before the rebalance, which from a late-March rebalance is about 42 trading days. That’s exactly the lag the sweep had found! The document also corrected a couple of things we had guessed wrong, including the cap on how much any one company can weigh and the order of the rules for keeping existing holdings, and those brought the gap down to under one percentage point.
I think this is the most useful thing I took from the whole exercise. Fitting the same parameters to returns would have picked a volatility window that, measured against the holdings, didn’t matter at all, and I would have declared the spec identified. On the other hand, matching about 100 specific companies across 13 real rebalances isn’t something that a single free parameter does by luck. So, if you’re validating a model or a reconstruction, look for the target that is hardest to hit by accident, and fit to that.
The Gate Was Green, but Were the Numbers Right?
The replica still only started in 2011, because the free source of company sizes it used begins around then. To reach back further, Claude and I used the same trick as in my last post. An S&P 500 index fund holds every company in the index in proportion to its size, and it has filed those holdings with the SEC going back to 1995. So, the value of each holding in those filings tells you the company’s size on that date.
The longer replica passed the gate again on the years where the real fund exists, with about 81% of its companies in common with the fund and an average weight error of 0.13 percentage points against the fund’s own filings.
Then I reviewed it, and the review still found three wrong numbers:
- The daily return series silently dropped one real day of returns in every rebalance period. After the fix, it agreed with the period-by-period returns, and a regression test now pins that.
- For a company that joined the index between two filings, a fallback took its size from the next filing. That’s leakage, since it uses a filing nobody could have seen yet, which is my last post in a single sentence. The effect was small, but the default is now strictly point-in-time, i.e. it only uses what was known on each date.
- Prices jumped at the point where one data vendor’s history hands over to another’s, so the long runs were redone on a single source, and the seam is filed as its own bug, which is still open.
The way I do these reviews isn’t sophisticated. On delicate or complex work, I ask a model to go through the result and find what’s wrong, often switching to a different model from the one that did the work, and I repeat this until the review stops finding anything major. All three of these turned up after every check had already passed.
Two more findings from that review were about noise rather than bugs. The first was that leaving out the companies that later failed, the survivorship bias from my last post, flattered the result by a measurable amount. It flattered it the most during the dot-com bust, because the missing companies were the ones that collapsed. The second was that shifting every rebalance date by a single week, earlier or later, moved the result about as much as fixing the survivorship bias had. Nobody chooses the calendar date their backtest happens to rebalance on, yet it moved the answer as much as a real data fix.
So, Could It Tell Itself From Luck?
No. After all of that, with a gate written in advance, passed on returns, checked against holdings and reviewed until the review went quiet, the reconstruction gave me 24 years of a momentum index, most of them from before the fund existed. Over those 24 years, its edge over the plain S&P 500 isn’t statistically established, meaning that it isn’t large enough, compared with the noise, to rule out luck.
The reconstruction did what it was built to do. When the edge you’re measuring is small and markets are noisy, telling skill from luck takes decades, not quarters, and even 24 years can fall short. My own model runs into the same wall: on the evidence so far, it isn’t statistically distinguishable from cheaper alternatives. What I decided to do about that is the subject of my next post.
What I’d Do From Day One
If I were starting a research project like this again, this is the list I’d hand to myself and to every agent working with me:
- Measure the noise before the first comparison. Run one configuration across several seeds and work out the smallest difference you can trust.
- Write the gate before the build. Freeze the spec and the pass/fail criteria first, with the reason for each, and make the thing you’re testing hard to tune by accident.
- Never widen a threshold. If the gate itself turns out to be wrong, say so in writing, split the job and keep the threshold.
- Fit to the hardest target you can find, e.g. holdings rather than returns.
- Review the work again after the gate passes, with a different model if you can, until the review stops finding things.
- Shift your dates. If moving the calendar by a week moves the answer, the answer is smaller than it looks.
- Keep the graveyard. Every closed experiment stays in the repo with the gate it was judged against and its verdict, so that the next person, or the next agent, can see what was already tried and why it failed.
Thanks for reading.
This describes software I run on my own accounts. It is not investment advice and I do not offer investment services.